

Regulated U.S. online casinos generated approximately $996.5 million in gross gaming revenue during June 2026, placing the market within $3.5 million of the symbolic $1 billion monthly threshold. The result was especially notable because June contained only 30 days and is not typically considered one of the strongest months for casino activity.
Revenue across the seven states with regulated online casino gaming increased 19.7% from approximately $832.8 million in June 2025. That amounted to nearly $163.7 million in additional year-over-year revenue and an average of approximately $33.2 million generated per day.
Pennsylvania, Michigan and New Jersey remained the dominant markets. Together, the three states produced approximately $875.3 million, or nearly 88% of the national total. Their scale shows how mature online casino jurisdictions are moving beyond an early-adoption phase and creating a more demanding competitive environment for operators, software suppliers and payment providers.
June Revenue Reached $996.5 Million Across Seven States
The national figure covers Connecticut, Delaware, Michigan, New Jersey, Pennsylvania, Rhode Island and West Virginia. Nevada permits online poker but does not offer the broader regulated online casino market found in those seven states.
Every regulated online casino state recorded year-over-year growth of at least 14% during June. Pennsylvania narrowly led the market when gross revenue before promotional deductions was used, while Michigan finished less than $2 million behind it. New Jersey remained a close third and reported another month of double-digit expansion.
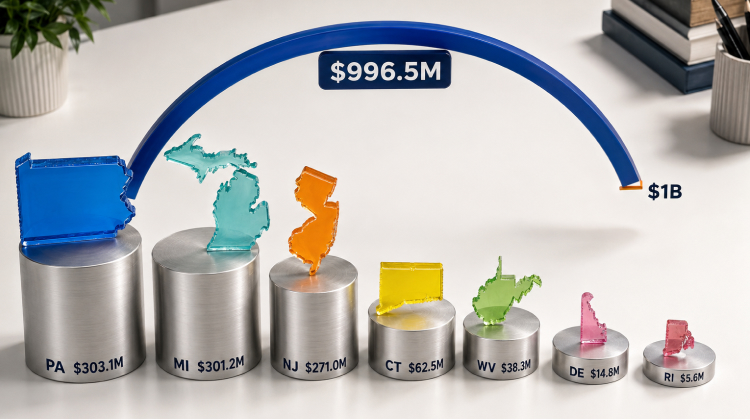
| State | June 2026 Gross Revenue | June 2025 Gross Revenue | Year-Over-Year Growth |
|---|---|---|---|
| Pennsylvania | $303.1 million | $265.2 million | 14.3% |
| Michigan | $301.2 million | $240.6 million | 25.2% |
| New Jersey | $271.0 million | $230.7 million | 17.5% |
| Connecticut | $62.5 million | $54.6 million | 14.4% |
| West Virginia | $38.3 million | $27.0 million | 41.9% |
| Delaware | $14.8 million | $9.8 million | 50.5% |
| Rhode Island | $5.6 million | $4.9 million | 14.3% |
| Combined Total | $996.5 million | $832.8 million | 19.7% |
The comparison uses gross revenue to keep the seven markets on a broadly consistent basis. That distinction matters because regulators do not all present promotional deductions, taxes and adjusted revenue in the same way.
For example, the Pennsylvania Gaming Control Board’s June report listed $242.5 million in regulated iGaming revenue after applicable promotional credits. Gross revenue before those deductions was approximately $303.1 million. Using one figure for Pennsylvania and a different accounting basis for another state would distort the national comparison.
Pennsylvania, Michigan And New Jersey Control Most Of The Market
The concentration of revenue in three states is one of the most consequential features of the June results. Pennsylvania, Michigan and New Jersey accounted for roughly seven of every eight dollars generated by regulated U.S. online casinos during the month.
Pennsylvania produced approximately $303.1 million in gross revenue, a 14.3% increase from June 2025. Its regulated market contains multiple casino brands operating through a smaller group of license holders, giving users broad platform choice while allowing the regulator to report results by licensee.
Michigan followed with $301.2 million in iGaming gross receipts, up approximately 25.2% year over year. The Michigan Gaming Control Board reported $289.21 million in adjusted iGaming gross receipts after authorized deductions. Operators also submitted $60.8 million in state iGaming taxes and fees during June.
New Jersey generated $271.04 million in internet gaming win. According to the New Jersey Division of Gaming Enforcement, that was 17.5% higher than the $230.71 million reported in June 2025. New Jersey’s year-to-date internet gaming win reached $1.59 billion through June, representing 15% growth from the corresponding 2025 period.
The three leaders have different licensing structures and reporting conventions, but their results point in the same direction. Online casino activity continues to expand even in markets that are no longer new. Growth is therefore coming from more than initial registrations or a first wave of mobile adoption.
Michigan Is Challenging Pennsylvania’s Market Lead
Only about $1.9 million separated Pennsylvania and Michigan in the gross-revenue comparison. That gap represented less than 1% of either state’s monthly total, making June one of the closest contests between the two markets.
Michigan’s 25.2% year-over-year growth also outpaced Pennsylvania’s 14.3%. If that difference persists, Michigan could move ahead in individual months without requiring a major regulatory change or a new statewide launch.
The competition is not simply about which state reports the largest total. It also reflects the strength of the operator ecosystems developing within each jurisdiction. Michigan had 15 authorized commercial and tribal operators offering iGaming as of June 2026. Pennsylvania’s market distributes brands across casino licensees, with Penn National, Valley Forge Casino Resort and Rivers Casino Philadelphia responsible for much of the state’s activity.
New Jersey remains equally important despite ranking third for June. The state has one of the longest-established regulated online casino systems in the country, and its internet gaming win exceeded its land-based casino win during the month. Atlantic City’s nine casino hotels generated $257.3 million from physical casino play, approximately $13.8 million less than the state’s online gaming total.
That crossover does not mean digital casino platforms are replacing physical properties in every respect. Retail casinos include hospitality, entertainment and employment functions that online platforms do not reproduce. It does show, however, that mobile and desktop casino products have become a primary revenue channel rather than a secondary extension of casino brands.
Platform Quality Matters More As Markets Mature
A market approaching $1 billion in monthly revenue places substantial pressure on platform infrastructure. Operators must support high transaction volumes, extensive game libraries, identity checks, geolocation systems, payment processing and customer-service activity without creating excessive friction.
Game quantity alone offers limited differentiation when many platforms carry overlapping content from the same software studios. Navigation, search accuracy, loading performance, account clarity and mobile stability become more important as catalogs expand.
The same competitive issue appeared in GClubGod’s analysis of the Borgata Online casino relaunch, where interface design and content discovery were treated as strategic features rather than cosmetic changes. A large library can become difficult to use when categories are inconsistent, recommendations are poorly explained or responsible-play controls are separated from the main account experience.
Payment performance is another part of that competition. Users expect deposits, identity reviews and eligible withdrawals to function predictably, but operators also need controls for fraud, account security and regulatory compliance. Removing too much friction can weaken safeguards, while unnecessary delays can reduce trust in an otherwise stable platform.
The strongest operators will need to balance convenience with clear rules. That includes transparent transaction histories, understandable verification requests and accurate information about how promotional credits affect balances and withdrawals.

Smaller States Are Growing From Different Starting Points
Although the three largest jurisdictions controlled most of the national total, some of the fastest percentage growth occurred in smaller markets. Delaware revenue rose approximately 50.5% to $14.8 million, while West Virginia increased 41.9% to $38.3 million.
Those percentages require context. A relatively small increase in absolute dollars can generate a large growth rate when the prior-year base is limited. Delaware added approximately $5 million year over year, while Michigan added more than $60 million despite recording a lower percentage increase.
Connecticut occupied the middle of the market with approximately $62.5 million in June revenue. The state authorizes online casino gaming through its tribal gaming framework and publishes revenue and state-payment information through the Connecticut Department of Consumer Protection.
Rhode Island remained the smallest regulated online casino jurisdiction, producing approximately $5.6 million. Its market is more concentrated than those in Michigan, New Jersey or Pennsylvania, limiting direct platform competition but still contributing to the national expansion.
These differences make simple state rankings incomplete. Population, licensing structure, number of available platforms, tax treatment and market age all affect revenue. A smaller jurisdiction may grow quickly without approaching the absolute scale of the leading states.
Reporting Differences Can Change The Headline Number
The $996.5 million national estimate is useful, but it should not be interpreted as a perfectly standardized federal statistic. Online casino revenue is collected and published by individual state regulators, and definitions can differ.
Gross gaming revenue generally represents wagers retained after player winnings but before certain deductions. Adjusted gross revenue may remove promotional credits or other permitted expenses. Taxable revenue can introduce another variation depending on state law.
Pennsylvania demonstrates the effect clearly. Its approximately $303.1 million gross figure falls to $242.5 million after promotional deductions reflected in the regulator’s published iGaming revenue total. That difference of more than $60 million is large enough to alter whether a combined national figure appears close to $1 billion.
The milestone should therefore be understood as an industry-scale indicator based on gross revenue, not as a single accounting figure produced by one national regulator. Consistent definitions are essential when comparing states, operators or different reporting periods.
Responsible-Gambling Systems Must Expand With Revenue
A monthly market approaching $1 billion also means online casino products are supporting a high volume of continuous activity. Unlike sports betting, casino games are not limited by a match schedule, season or event calendar. Platforms can remain accessible throughout the day.
That availability makes responsible-gambling design a central operational requirement. Deposit and loss limits, session reminders, transaction histories, cooling-off periods and self-exclusion options should be easy to find and configure. Account controls are less effective when they are buried in menus or described through unclear language.
Growing markets also produce more data that operators can use to identify potentially harmful behavior. However, automated monitoring should complement accessible human support and transparent policies rather than functioning as an invisible compliance exercise.

Regulators face a related challenge. Revenue and tax growth can create incentives for expansion, but oversight must keep pace with platform personalization, payment speed and increasingly sophisticated engagement systems. The durability of regulated online casino growth will depend partly on whether consumer protections advance alongside commercial technology.
The Next Billion-Dollar Month Is Increasingly Likely
June’s $996.5 million result fell just short of the headline threshold, but the broader trend was stronger than the narrow miss suggests. Revenue grew nearly 20% year over year, every regulated state recorded double-digit expansion and the seven markets produced approximately $6.03 billion during the first half of 2026. (Share the Thrill With Top Sports Casino Social Features)
A future month exceeding $1 billion would be symbolically important, but it would not fundamentally change the market by itself. The more important development is that billion-dollar monthly performance is becoming plausible within only seven states.
That limited geographic footprint leaves the industry concentrated in a small group of jurisdictions and dependent on state-level legislative decisions. At the same time, it gives established markets an outsized influence over platform design, licensing practices, payment controls and responsible-gambling standards.
For operators, the next phase will be shaped less by whether the national total crosses a round number and more by how sustainably they compete within mature markets. Reliable technology, clear account management, secure payments and visible player protections will matter as much as the size of any monthly revenue record.